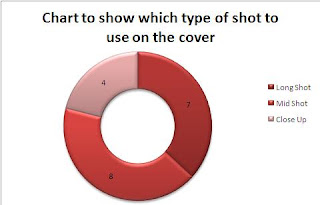
Below there are a series of graphs showing the data which i collected for the different questions which were asked throughout my questionnaire.
The second question which I asked was which colour scheme would they most like to see on the magazine, the most popular answer was red so I chose to have a red colour scheme throughout my magazine.
For this question I asked what magazines they frequently purchase, the most popular magazine which was bought on a regular basis was Look magazine.
In this question I asked how much they would be willing to spend on a magazine, the most popular answer was £5.00, but as I thought that not everyone would buy it for that price, I chose to sell my magazine for £3.00 as it was a more reasonable price.
This question asks


No comments:
Post a Comment